In this post, I discuss how to configure an elasticsearch cluster with large datasets, particularly when using logstash.
I’ve recently been involved in setting up an elasticsearch cluster for logstash. Not only do we store system logs and application logs, we also use elasticsearch to store a firehose of API metrics.
Being able to visualise and query the whole firehose is very valuable, but it took a little care to configure our cluster to handle 50 million events per day.
Contents
- You Need a Test Cluster
- Name Everything
- Avoid Vote Ties
- Test Your Clients with Cluster Outages
- Practice Cluster Restarts
- Set Up Visualisations
- Avoid Routing on Data Nodes
- Be Generous with Memory
- Rotate Indices Automatically
- Monitor Your Thread Pools
- Choose the Right Number of Shards
- Final words
You Need a Test Cluster
This should go without saying, but you will need a test cluster. Elasticsearch has a lot of configuration options, rich APIs, and you will need to experiment.
The main thing to test against your cluster is configuration
changes. Try different settings and see what happens. Try making
changes in both the elasticsearch.yml configuration file and using
the
cluster settings API.
Another important thing to test is rolling cluster restarts. You will need to do these for most configuration changes, and whenever you upgrade elasticsearch versions.
Don’t forget to test failure modes. How many nodes can you lose and
still accept reads and writes? What happens if one of your nodes runs
out of disk space? What happens if you set ES_HEAP_SIZE too small?
Since elasticsearch is resource intensive, you may not have as much hardware for your test cluster. However, it should be as similar as possible, and it should definitely have the same number of nodes. You can run multiple nodes on the same machine if necessary.
Name Everything
By default, elasticsearch nodes get autogenerated names from a Marvel corpus. You will want to give your nodes sensible names according to where they’re running.
# ELASTICSEARCH.YML
node.name: "data-node-1-london"
Elasticsearch automatically discovers other nodes on the network and joins them to your cluster. This is often unwise: you could end up with important data on random test nodes that developers have started up. Instead, configure your cluster to only use explicitly mentioned nodes.
# ELASTICSEARCH.YML
cluster.name: logstash-prod

discovery.zen.ping.multicast.enabled: false
discovery.zen.ping.unicast.hosts: ["data-node-1-london", "data-node-2-cambridge", "dataless-node-1-london"]
Avoid Vote Ties
Elasticsearch nodes vote for a master node. Make sure that
minimum_master_nodes is greater than total nodes / 2, so you never
get a split brain (so multiple nodes think they’re master).
We initially had two data nodes, so we set minimum_master_nodes
conservatively:
# ELASTICSEARCH.YML
discovery.zen.minimum_master_nodes: 2
However, if only a single node is down, master election wouldn’t occur and the cluster wouldn’t accept writes. To solve this, we added a third, dataless node.
# ELASTICSEARCH.YML
node.name: "dataless-node-1-london"
node.data: false
Dataless nodes require far less memory (ours has ES_HEAP_SIZE=1G)
but should otherwise be configured identically. Ideally, they should
run on a separate machine.
Test Your Clients with Cluster Outages
If your cluster becomes unavailable, clients may not continue writing when the cluster is back up. Using logstash, we see warnings in the logs when this happens:
{:timestamp=>"2015-01-02T10:36:32.262000+0000", :message=>"Failed to flush outgoing items", :outgoing_count=>100, :exception=>#<Errno::EBADF: Bad file descriptor - Bad file descriptor>, :backtrace=>["org/jruby/RubyIO.java:2097:in `close'", "/opt/logstash/1.4.2/vendor/bundle/jruby/1.9/gems/ftw-0.0.39/lib/ftw/connection.rb:173:in `connect'", "org/jruby/RubyArray.java:1613:in `each'", "/opt/logstash/1.4.2/vendor/bundle/jruby/1.9/gems/ftw-0.0.39/lib/ftw/connection.rb:139:in `connect'", "/opt/logstash/1.4.2/vendor/bundle/jruby/1.9/gems/ftw-0.0.39/lib/ftw/agent.rb:406:in `connect'", "org/jruby/RubyProc.java:271:in `call'", "/opt/logstash/1.4.2/vendor/bundle/jruby/1.9/gems/ftw-0.0.39/lib/ftw/pool.rb:48:in `fetch'", "/opt/logstash/1.4.2/vendor/bundle/jruby/1.9/gems/ftw-0.0.39/lib/ftw/agent.rb:403:in `connect'", "/opt/logstash/1.4.2/vendor/bundle/jruby/1.9/gems/ftw-0.0.39/lib/ftw/agent.rb:319:in `execute'", "/opt/logstash/1.4.2/vendor/bundle/jruby/1.9/gems/ftw-0.0.39/lib/ftw/agent.rb:217:in `post!'", "/opt/logstash/1.4.2/lib/logstash/outputs/elasticsearch_http.rb:215:in `post'", "/app/AHL/logstash/1.4.2/lib/logstash/outputs/elasticsearch_http.rb:210:in `flush'", "/opt/logstash/1.4.2/vendor/bundle/jruby/1.9/gems/stud-0.0.17/lib/stud/buffer.rb:219:in `buffer_flush'", "org/jruby/RubyHash.java:1339:in `each'", "/opt/logstash/1.4.2/vendor/bundle/jruby/1.9/gems/stud-0.0.17/lib/stud/buffer.rb:216:in `buffer_flush'", "/opt/logstash/1.4.2/vendor/bundle/jruby/1.9/gems/stud-0.0.17/lib/stud/buffer.rb:193:in `buffer_flush'", "/opt/logstash/1.4.2/vendor/bundle/jruby/1.9/gems/stud-0.0.17/lib/stud/buffer.rb:159:in `buffer_receive'", "/app/AHL/logstash/1.4.2/lib/logstash/outputs/elasticsearch_http.rb:188:in `receive'", "/opt/logstash/1.4.2/lib/logstash/outputs/base.rb:86:in `handle'", "(eval):235:in `initialize'", "org/jruby/RubyProc.java:271:in `call'", "/opt/logstash/1.4.2/lib/logstash/pipeline.rb:266:in `output'", "/opt/logstash/1.4.2/lib/logstash/pipeline.rb:225:in `outputworker'", "/opt/logstash/1.4.2/lib/logstash/pipeline.rb:152:in `start_outputs'"], :level=>:warn}At this point, you need to restart logstash. However, logstash
provides three elasticsearch outputs: elasticsearch,
elasticsearch_http and elasticsearch_river. In our testing we
found that elasticsearch_http was more resilient during cluster
restarts and could handle brief outages.
# LOGSTASH.CONF
output {
  elasticsearch_http {
    host => "es-cluster.example.com"
  }
}
Practice Cluster Restarts
Cluster restarts can be quite common, so you will want to do a rolling restart so your cluster suffers no downtime.
The correct way to restart a node is to disable rebalancing, restart one node, enable rebalancing, then repeat on the other nodes.
# Prevent rebalancing whilst our node is unavailable.
$ curl -XPUT 'http://some-node:9200/_cluster/settings' -d '{
    "transient" : {
        "cluster.routing.allocation.enable" : "none"
    }
}'

# Shutdown this node.
$ curl -XPOST 'http://some-node:9200/_cluster/nodes/_local/_shutdown'

# Now start the node again, and verify that it's joined the cluster.

# Enable rebalancing again.
$ curl -XPUT 'http://some-node:9200/_cluster/settings' -d '{
    "transient" : {
        "cluster.routing.allocation.enable" : "all"
    }
}'

# Repeat on other nodes.
Cluster rebalancing can be slow (up to twenty minutes on our cluster). You can improve performance by increasing the bandwidth limit and maximum number of shards that a node will recover.
# ELASTICSEARCH.YML
# The smaller your shards are, the higher you should set this value.
# Since logstash splits its data into daily indices, you may have
# a larger number of smaller shards.
cluster.routing.allocation.node_concurrent_recoveries: 5

indices.recovery.max_bytes_per_sec: 50mb
You can use rolling restarts for upgrades, unless you’re upgrading from elasticsearch 0.X to 1.X.
Set Up Visualisations
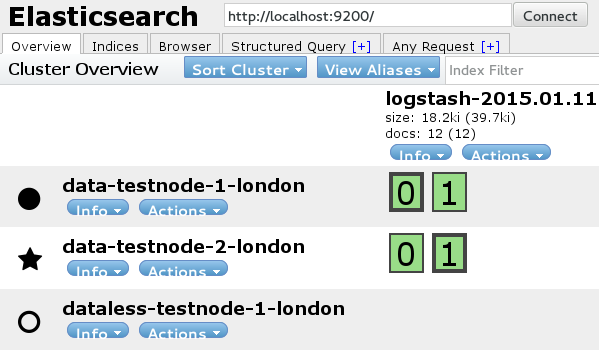
We use the head plugin extensively, which makes it easy to see the current state of our clusters. We’ve deployed it on a static web server, so we can use it with any node on any cluster.
We also use kibana for generally visualising our logstash data. However, it’s also really useful for looking at how fast we’re writing events to elasticsearch, and what the biggest sources are.
Avoid Routing on Data Nodes
You have a number of options for elasticsearch routing. One popular option is to set up a round-robin proxy in front of all your elasticsearch nodes.
However, if your cluster is being used heavily, it’s better if routing
is handled by a dataless node. In our setup, clients write to
http://eventlogger:9200, but eventlogger is simply a DNS entry
that points to dataless-node-1-london.
Be Generous with Memory
When you have a large dataset, try to give ES as much memory as you can. The correct amount will vary depending on your workload, so measure memory usage on your cluster.
Tuning GC is a very important part of maximising performance, so you will definitely want GC logging enabled.
# ELASTICSEARCH STARTUP SCRIPT
export ES_USE_GC_LOGGING=yes
The most important setting for memory is ES_HEAP_SIZE. You’ll
usually want to set this to
half the memory available,
but
ensure you don’t set it above ~30GiB.
# ELASTICSEARCH STARTUP SCRIPT
# In our case, our data nodes have 96GiB RAM, so we hit the max
# recommended heap size for a single node.
export ES_HEAP_SIZE=31G
If your heap is more than 6GiB, you may benefit from using the G1GC garbage collector (see the ‘Some Recommendations’ section). Note that the ES team don’t recommend this (and the Lucene people strongly recommend against it), although ES is regularly tested with G1GC.
# ELASTICSEARCH STARTUP SCRIPT
# Enable G1GC, taken from
# https://github.com/elasticsearch/elasticsearch/issues/5823#issuecomment-59782959
export ES_JAVA_OPTS="-XX:-UseParNewGC -XX:-UseConcMarkSweepGC -XX:+UseG1GC"
Finally, you may find that your heap fills up and stays full. If that becomes a problem, you may want to adjust your field data cache size.
Rotate Indices Automatically
Logstash will write data continually, so you will want a solution for preventing your hard disk from filling up. We use curator, which automatically deletes the oldest indices for you.
# Run as a cron job. In this case, we limit our total logstash index
# size to 500 GiB.
$ curator --host localhost -C space -g 500
Monitor Your Thread Pools
When there are bursts of high writes, you will see higher thread pool usage. This may because of genuine bursts of data, or when unassigned shards are allocated to a node (common during cluster restarts).
The node stats API will show you the current settings for queue size, and allows you to see how full your queues are currently:
$ curl http://test-es-cluster:9200/_nodes/stats/thread_pool?pretty
{
  "cluster_name" : "test-cluster",
  "nodes" : {
      "thread_pool" : {
        ...
        "index" : {
          "threads" : 0,
          "queue" : 0,
          "active" : 0,
          "rejected" : 0,
          "largest" : 0,
          "completed" : 0
        },
        ...
        "merge" : {
          "threads" : 5,
          "queue" : 0,
          "active" : 0,
          "rejected" : 0,
          "largest" : 5,
          "completed" : 1810
        },
        "bulk" : {
          "threads" : 16,
          "queue" : 0,
          "active" : 3,
          "rejected" : 0,
          "largest" : 16,
          "completed" : 8775
        },
      }
    },
If your thread pool fills up, you can end up seeing
EsRejectedExecutionException. In this case, you will want to
increase thread pool sizes.
# ELASTICSEARCH.YML
# Increase the index queue size to help our threads
# keep up with bursts of writes (default: 200).
threadpool.index.queue_size: 400
Choose the Right Number of Shards
Using too few shards prevents you from making full use of your cluster, but there are performance overheads introduced with more shards (here’s a benchmark, a warning in the docs).
To make full use of the cluster, you want:
number of shards * (number of replicas + 1) >= number of data nodes
For our cluster with two data nodes, we settled on two shards, each with one replica. This is less than the default, but still gives us scope to add another two data nodes without reducing utilisation.
# ELASTICSEARCH.YML
# The default number of shards is 5.
index.number_of_shards: 2
index.number_of_replicas: 1
Final words
Elasticsearch can be very demanding on hardware. Plan to keep up-to-date on new elasticsearch versions, as performance and resiliency generally improves with each version. Likewise, upgrading your Java version is often worthwhile, as garbage collection algorithms have improved over time (e.g. string compaction).
When in doubt, raise questions on the mailing list or file bugs on the issue tracker. The community is friendly and helpful.